Why can the data in the Excel chart made by other people be selected? And the corresponding chart will change along with it. Today we will learn how to make this kind of chart that can switch data in one second.
Let’s first create a table to give an example.

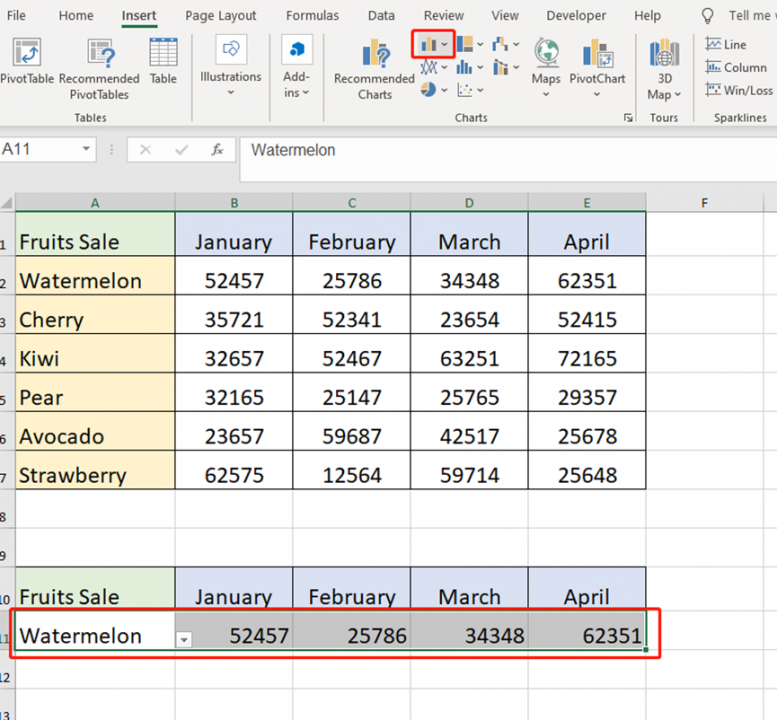
We first copy and paste the first row of the table below.

Select cell A11 and go to the Data tab to choose Date Validation.
Allow list and select the source A2:A7.

Now we will find a drop-down menu in cell A11.

Type =VLOOKUP(A11,A1:E7,2,0) in cell B11 and press Enter key and fill right.


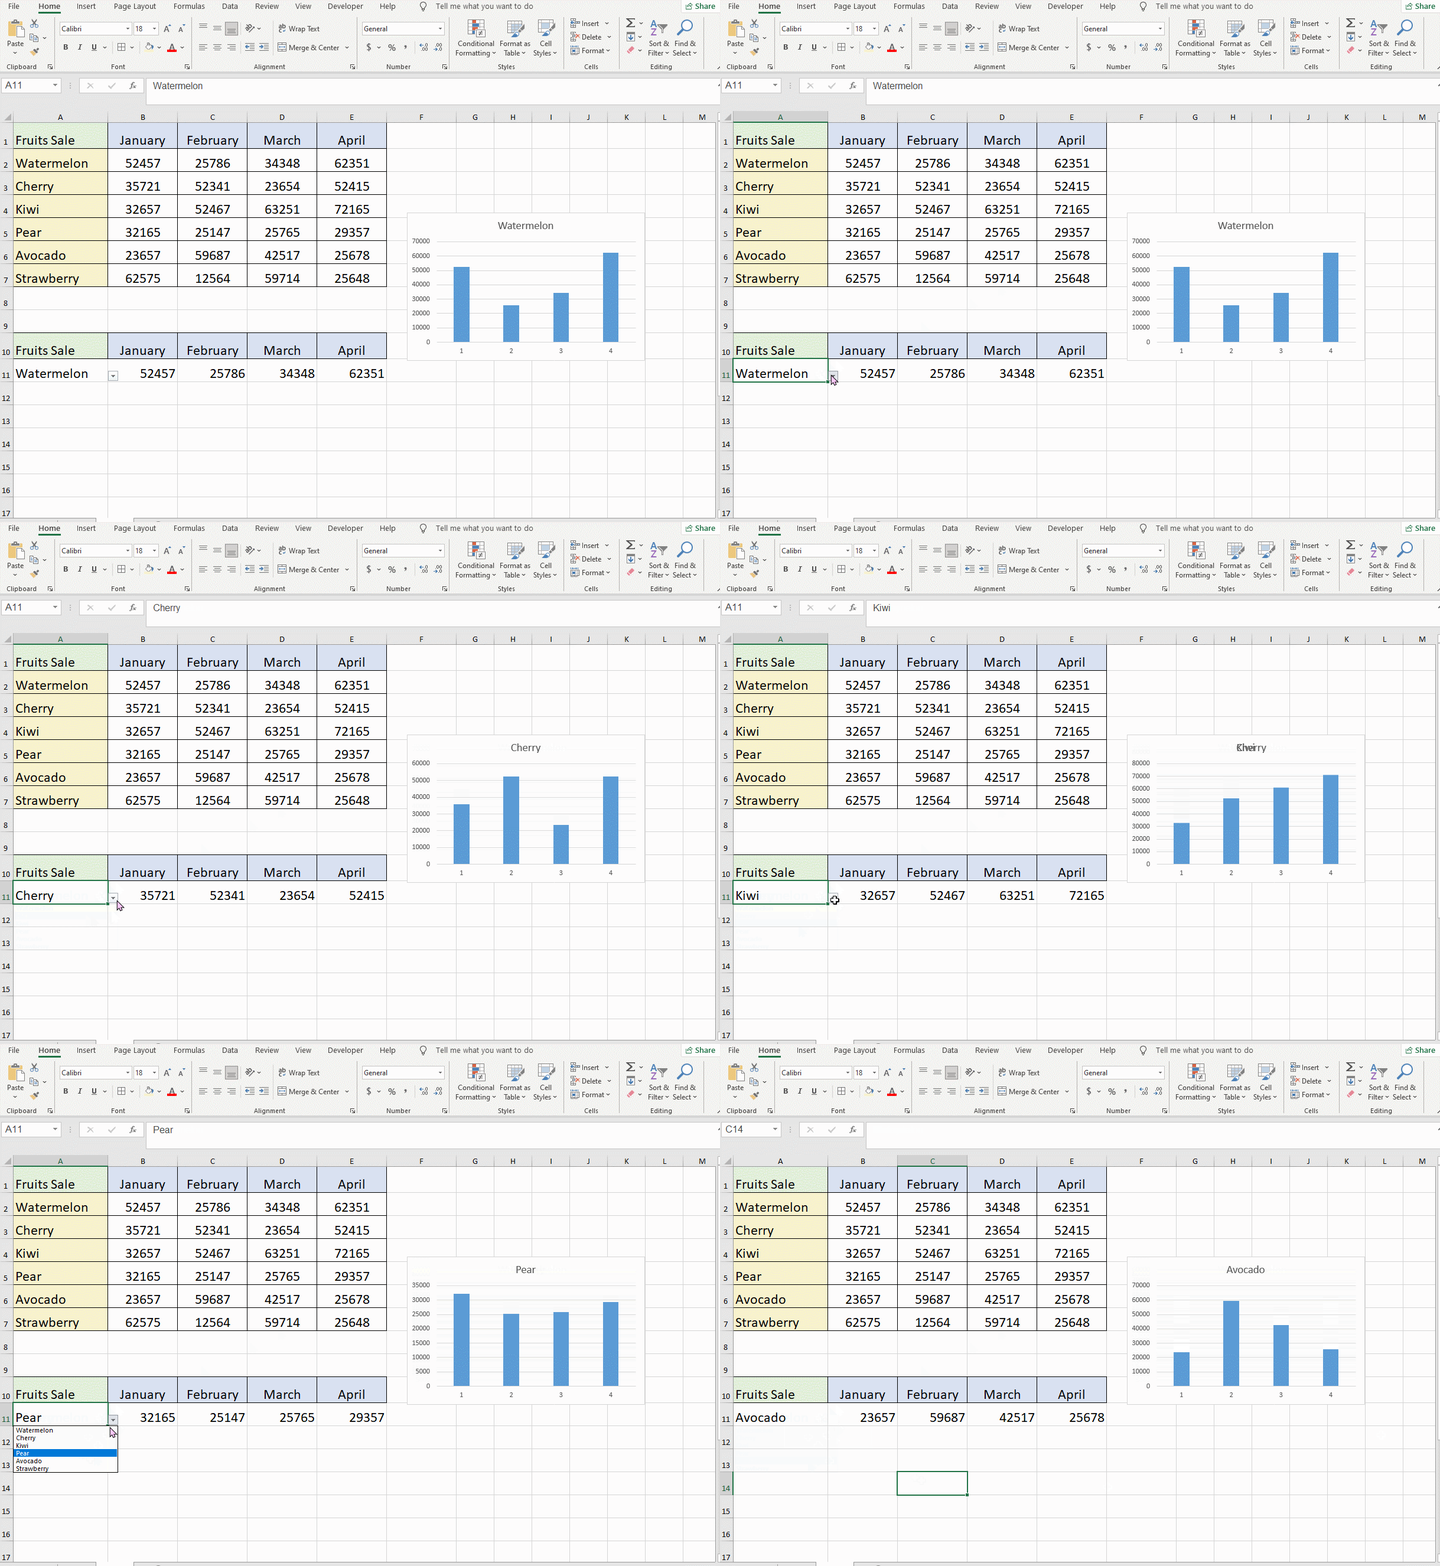
When we change the fruit type in cell A11, the sales volume on the right will also become corresponding.

Highlight the watermelon sale from January to April and insert a chart.

If we change the type of fruit from watermelon to kiwi, then the watermelon chart will immediately become a kiwi sales table.


Leave a Reply