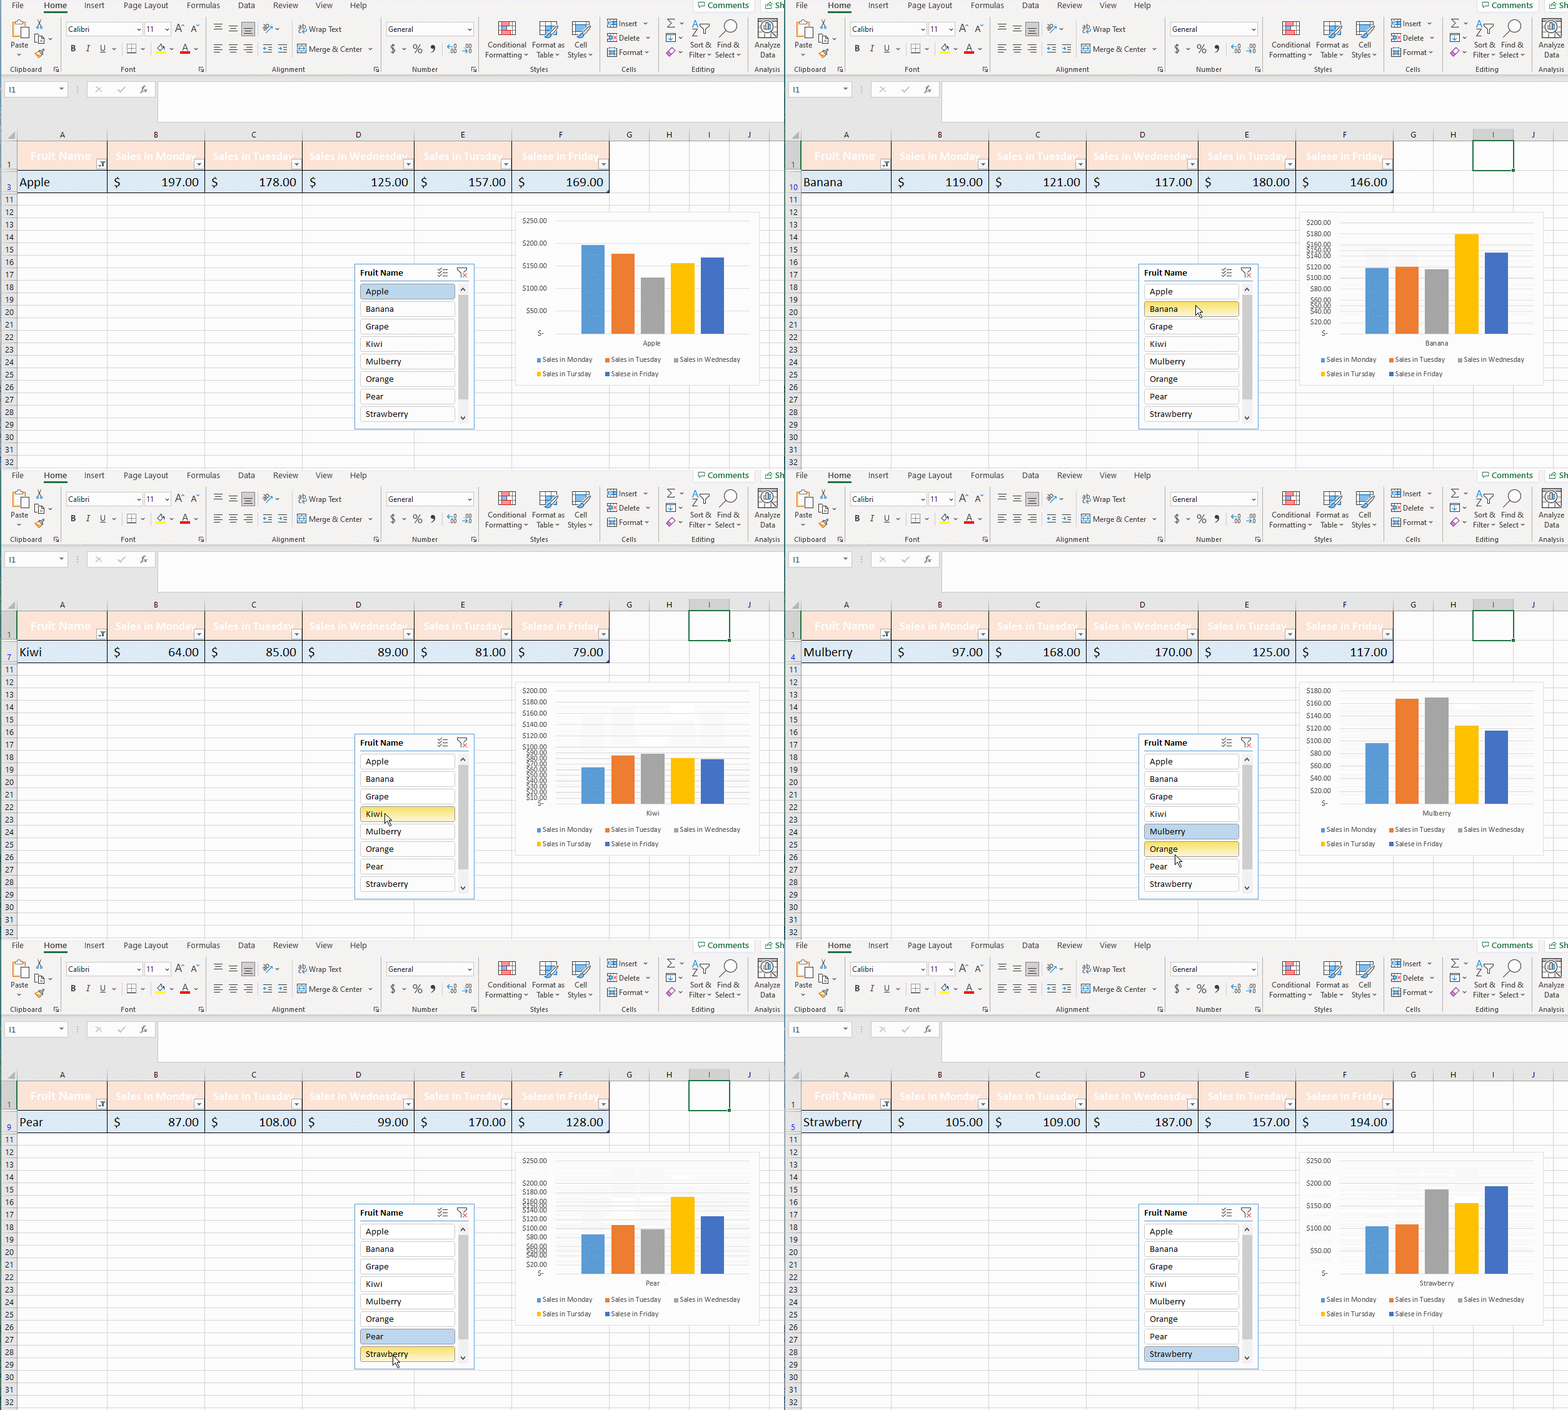
We’ve known how to create a dynamic graph in Excel. In our today’s tutorial, we are going to know how to create a dynamic table in Excel.
Here is a fruit sale table from Monday to Friday.
We first select the table area and press Ctrl + T to create the table dialog box.


Go to the insert tab and insert a 2-D column.

Then, click on the Insert Slice.

Choose Fruit Name in the list.

When we click on the different types of fruits. The chart would be changed into the corresponding sale table.


Leave a Reply