A chart in your document can convey all the information in a more vivid and visual way than traditional sheet. You may have seen many different kinds of charts in daily life – column, pie, stock, radar, etc. The good news is you can try all styles in Word within several clicks. Here’s a simple guide of inserting charts in Word 2016.
1. Open a Word ducument, put the cursor at the place where you want to insert a chart.
2. Select Insert tab, click Chart button in Illustrations section.

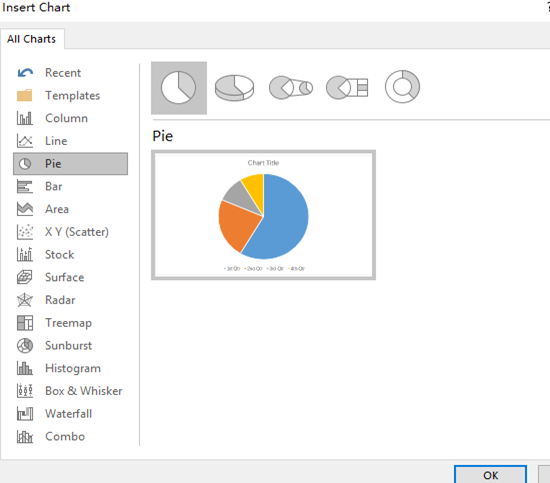
3. There are many different types of chats in Insert Chart window. Before making a choice, you should consider that which kind of chart is most suitable for the data you want to display.

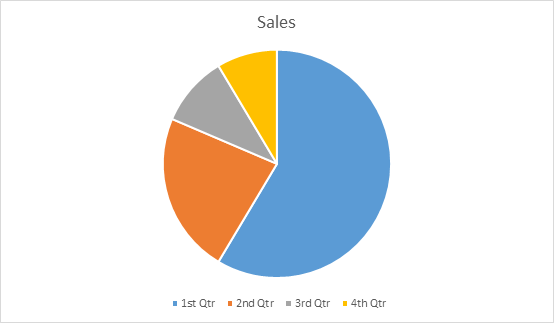
4. After selecting a specific chart and hit OK, you can immediately find it inserted to the document.
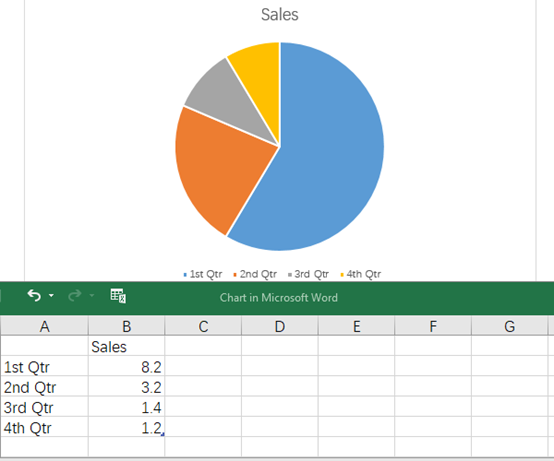
Then you can edit the text and numbers in the popping out sheet below, the chart will change along with it.

4. Finish the editing and close the sheet. Now you’ve got a chart in Word document.


Write more, thats all I have to say. Literally, it seems as though you relied on the video to make your point. You obviously know what youre talking about, why waste your intelligence on just posting videos to your site when you could be giving us something informative to read?
Thanks a lot for the blog article.Really looking forward to read more. Want more.