Treemap is a simple chart in which you can see the value of each item from the spreadsheet clearly and intuitively. It’s a little bit like pie chart but not that focusing on showing each item’s share of the total. If you’d like to try creating a treemap in your Excel file, here’s the method:
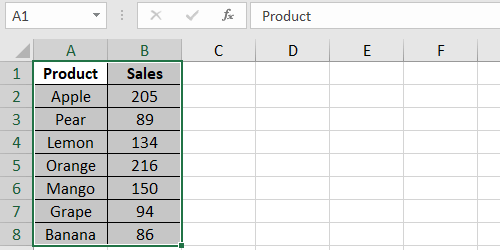
First, open the Excel file and select all the cells in the table.


Switch to Insert tab.


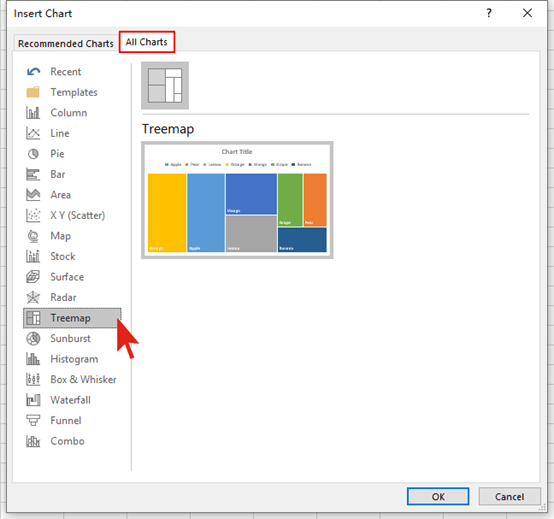
Find Charts section and click the small arrow in the bottom right corner to open the Insert Chart window.


Switch to All Charts tab, choose Treemap in the list.


Place the cursor over the imagine on the right. You can see a preview for the treemap.
If it’s good enough for you, click OK and it will be actually inserted to your Excel sheet.
You can click the chart and hit the small icon of paint brush on the right to adjust its style and color.
This is the simple guide to make a treemap in Microsoft Excel.

View Comments (1)
Hey there! Someone in my Facebook group shared this website with us so I came to give it a look. I'm definitely enjoying the information. I'm book-marking and will be tweeting this to my followers! Terrific blog and excellent style and design.